Third-party tests · independent validation
Three independent tests by three separate teams. Same conclusion every time.
98.7%
F1 ACCURACY
Geoff Carss & Annabel Jeffries
Wilder Sensing
"We tested a range of existing solutions using real acoustic data, and BioSonic clearly stood out, achieving 98.7% accuracy (F1 score) and giving us full confidence in the results we're bringing to the platform."
higher is better · bars start at 50% baseline
PRECISION · BioSonic +36.4pt
RECALL · BioSonic +7.9pt
F1 SCORE · BioSonic +25.7pt
| PREDICTED BAT | PREDICTED NO BAT | |
| ACTUAL BAT | 730 TRUE POSITIVE | 3 FALSE NEGATIVE |
| ACTUAL NO BAT | 13 FALSE POSITIVE | 4,579 TRUE NEGATIVE |
| PREDICTED BAT | PREDICTED NO BAT | |
| ACTUAL BAT | 543 TRUE POSITIVE | 49 FALSE NEGATIVE |
| ACTUAL NO BAT | 174 FALSE POSITIVE | 4,503 TRUE NEGATIVE |
Cost: investigator time wasted reviewing non-bat audio, inflated species counts
13
174
Kaleidoscope: 13.4× more
Cost: protected species overlooked, incomplete EIA, compliance risk
3
49
Kaleidoscope: 16.3× more
Same data, very different outcomes. BioSonic delivers 98.7% F1 with only 16 errors across 5,325 predictions. Kaleidoscope Pro misses nearly 9% of true bats and produces 13× more false calls.
So BioSonic's F1 accuracy is roughly 25 percentage points higher. The most striking difference is precision: BioSonic was correct 97.8% of the time it flagged a species, vs 61.4% for Kaleidoscope. That precision gap is what drives the validation-time savings, since Kaleidoscope produced far more false positives to weed out (277 vs 16).
Identical
D4 > D5 > D2 > D1 > D3 — same order whether counted by hand or by AI. Same ecological conclusion about which sites had the most activity.
11 → 100
NATTER'S BAT CALLS
Going through tens of thousands of files by hand, it's easy to miss a few. On review, every one of BioSonic's 100 Natter's bat calls was validated as correct. That's the payoff of AI on large datasets — rare species don't slip through.
BioSonic detects more Pipistrel (+203%) and Trold (+16%)
Separate scale — these are the ones that matter for Annex II compliance
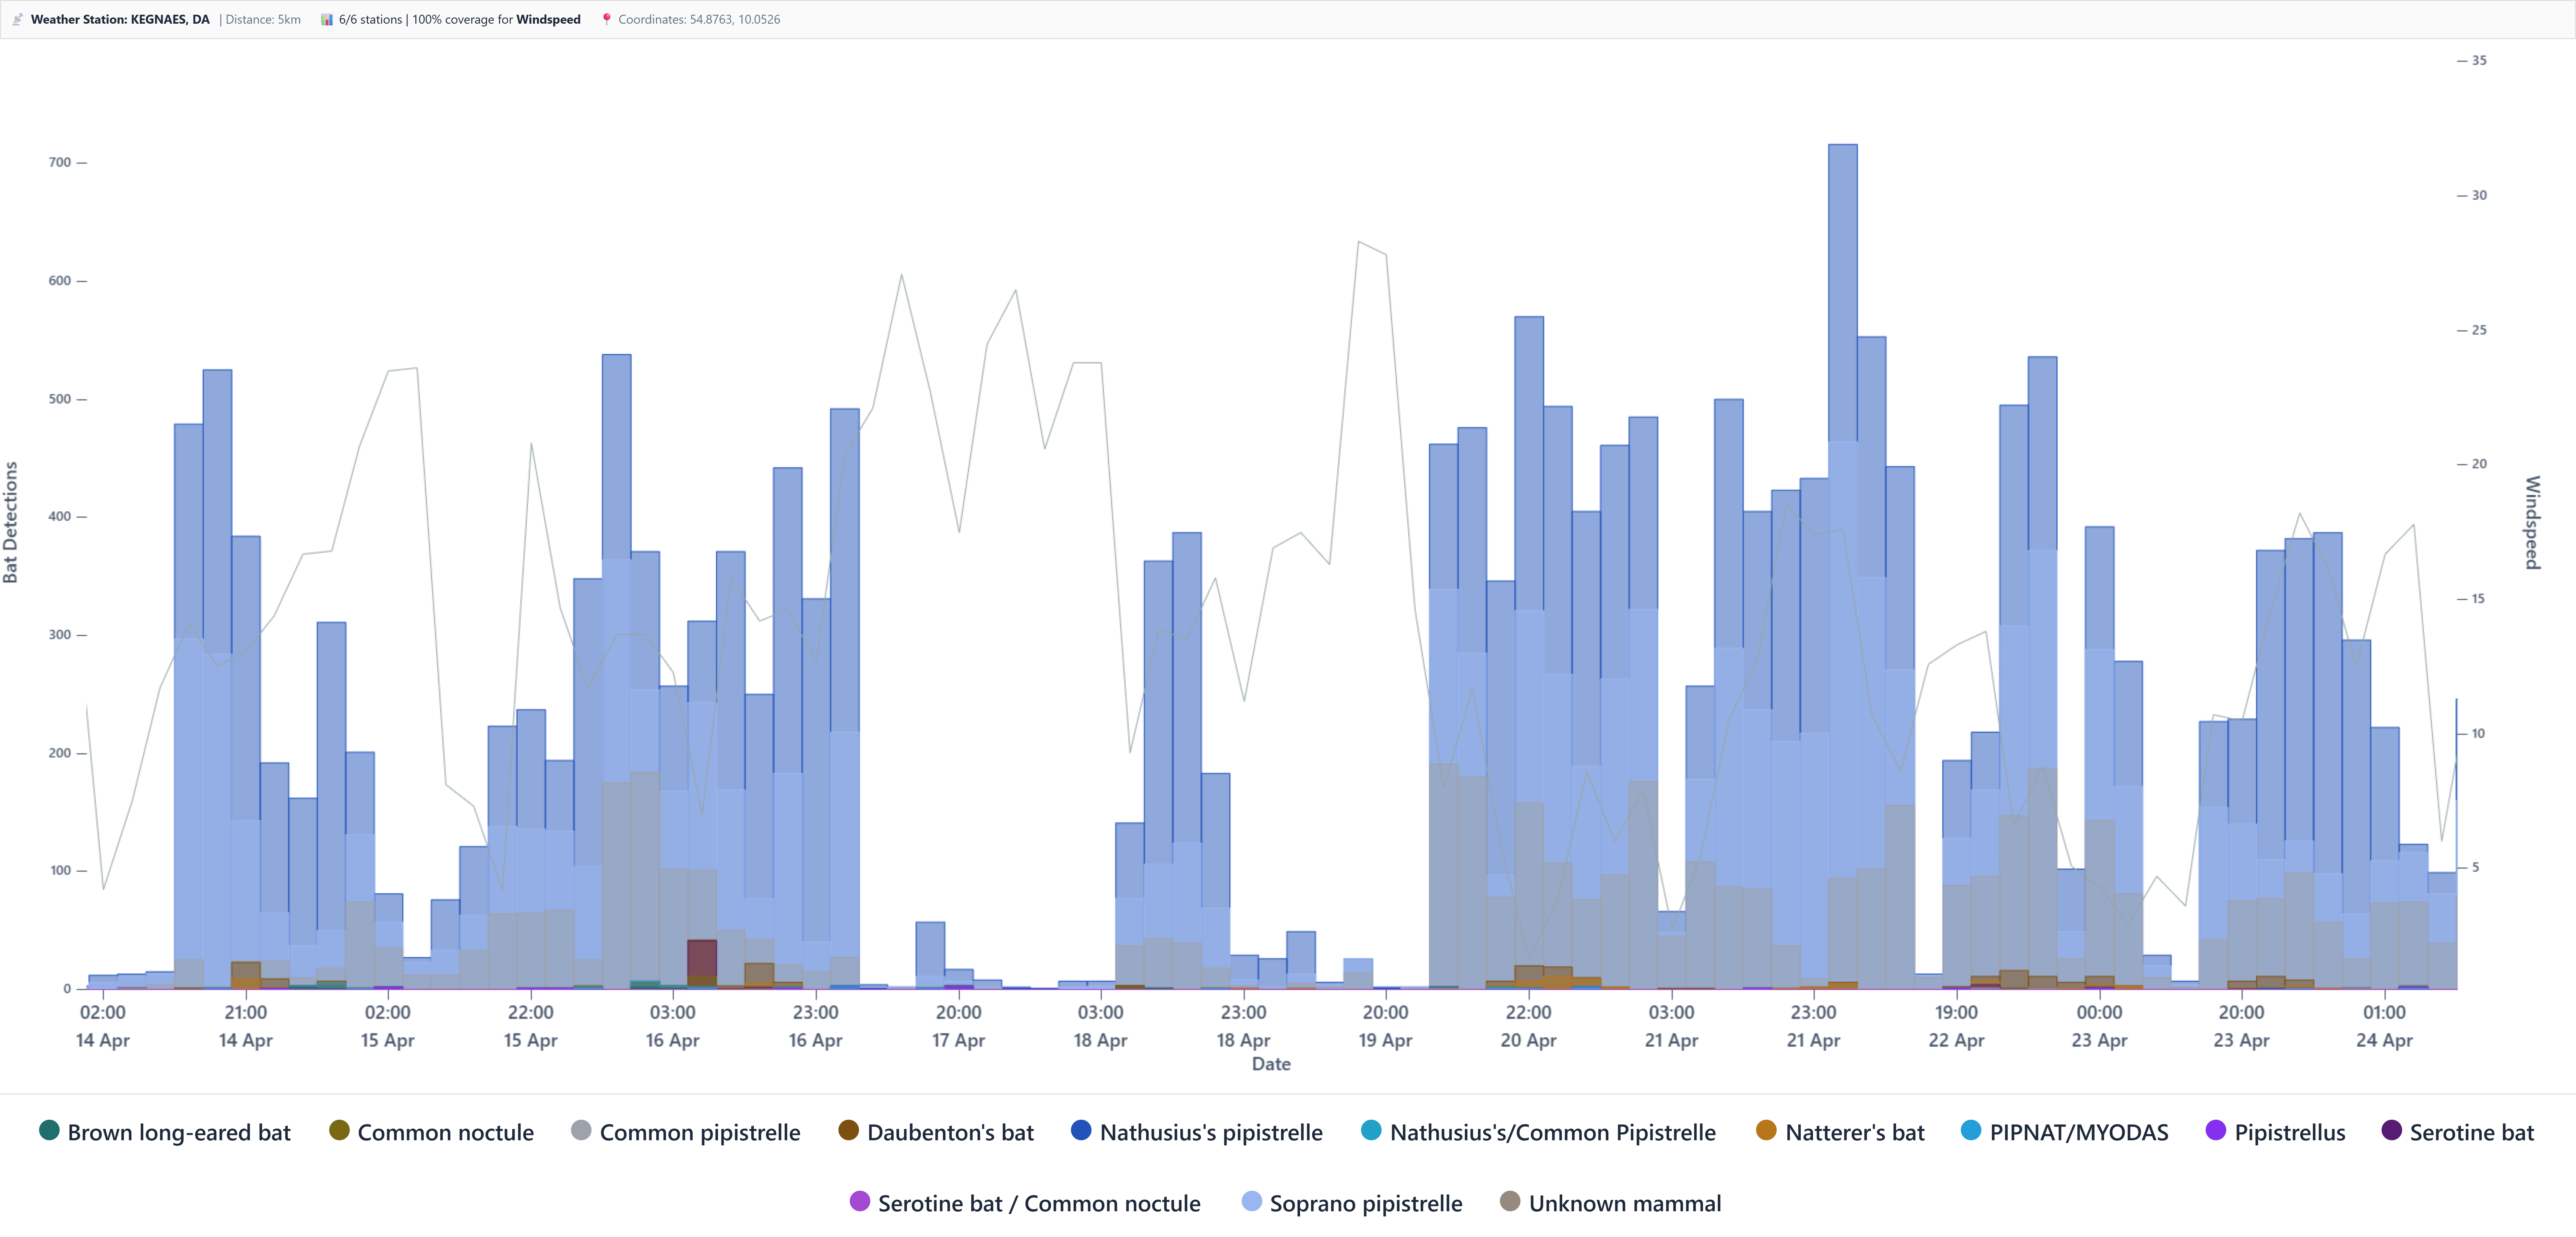
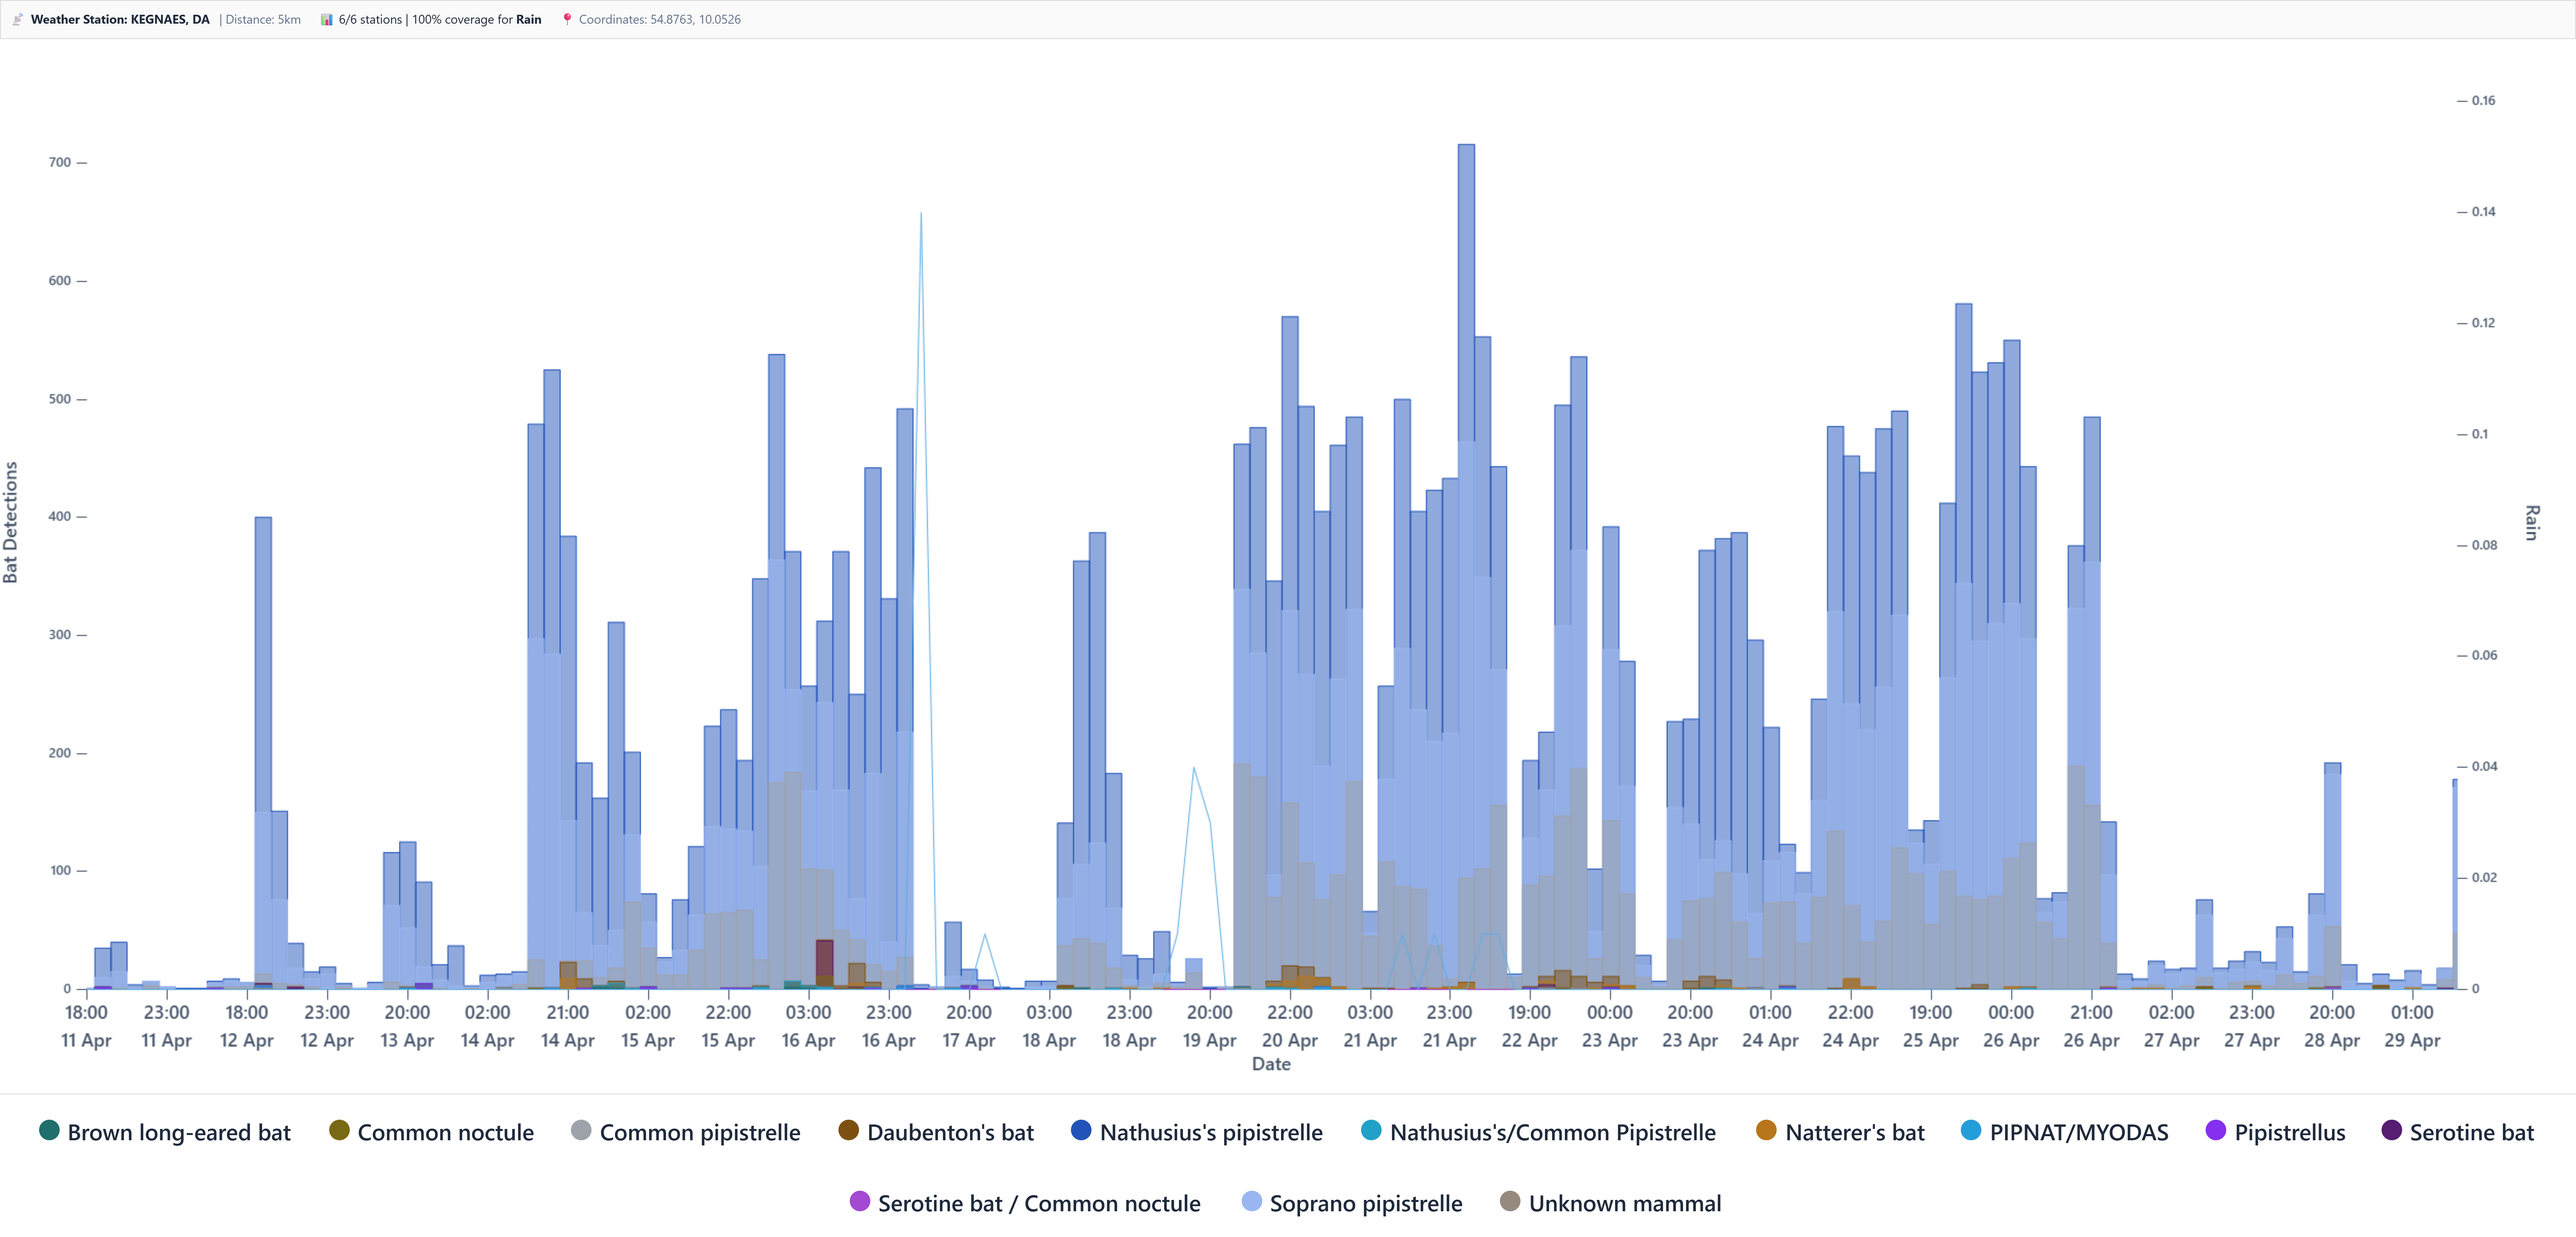
Weather integration
And the human cost
According to Consultancy in Southern England
KALEIDOSCOPE WORKFLOW
490 hrs
12 weeks to client
BIOSONIC WORKFLOW
163 hrs
4 weeks to client
✓ 327 hours back · This means £21,255 saved at standard UK consultant rate
Watch
Run it on your own data
josef.carlson@biosonic.se · +46 72 744 65 85