BioSonic
NATURE SPEAKS. WE TRANSLATE.
The most accurate bat sound analysis available.

BioSonic uses image recognition on spectrograms to identify bat species, filter noise, and separate feeding and social calls — automatically.

Try 15 GB for free
USED BY LEADING CONSULTANCIES
1. The problem with your AutoID
FALSE DETECTION
Why it keeps missing those faint calls
SCENARIO B — Real Barbastelle hidden behind grasshopper noise

BARBAR echolocating behind grasshopper noise. Kaleidoscope sees only the most loud part of the sound (many times, that’s noise) — BioSonic finds the bat using image recognition on the spectrogram.

KALEIDOSCOPE PRO
Echo pattern lost under noise floor — missed
🦗🦇
— NOISE ONLY — No bat detected (Barbastelle missed)
BIOSONIC
Echolocation pattern locked under noise floor
Found
✓ BAT: BARBAR · 78% confidence · Social call
SCENARIO A — Grasshopper noise, no bat present

Same noise. Different conclusion.

KALEIDOSCOPE PRO
Sees a busy spectrogram → assumes bat
🦗
⚠ BAT DETECTED: BARBAR (Barbastelle) · Confidence: Low
BIOSONIC
Trained on 3.5M noise files · full spectrogram, full context
🦗
✓ NOISE — No bat detected.
2. How AI beats your current AutoID
HEAD-TO-HEAD VALIDATION
Independent experts confirm BioSonic's accuracy

Two independent studies — one from UK sensor platform Wilder Sensing, one from Denmark's leading bat expert — plus a direct comparison against Kaleidoscope Pro on the same dataset.

THIRD-PARTY TESTING
Wilder Sensing · Geoff Carss + Annabel Jeffries
98.7%
F1 ACCURACY
“We tested a range of existing solutions using real acoustic data, and BioSonic clearly stood out, achieving 98.7% accuracy (F1 score) and giving us full confidence in the results we’re bringing to the platform.”
BIOSONIC VS KALEIDOSCOPE PRO
Same audio, same ground truth · Grassland + Paludiculture dataset

BioSonic scores 98.7% F1 vs Kaleidoscope Pro’s 73.0% F1 — a 25.7 point gap. Kaleidoscope produces 17× more false positives and 16× more false negatives.

BIOSONIC F1
98.7%
Precision 97.8% · Recall 99.6%
F1 GAP
+25.7pt
BioSonic outperforms Kaleidoscope by nearly 26 percentage points
KALEIDOSCOPE PRO F1
73.0%
Precision 61.4% · Recall 90.0%
METRIC COMPARISON
Higher is better on all three · bars start at 50% baseline to highlight the gap
PRECISIONBioSonic +36.4pt
BioSonic
97.8%
Kaleidoscope
61.4%
RECALLBioSonic +9.6pt
BioSonic
99.6%
Kaleidoscope
90.0%
F1 SCOREBioSonic +25.7pt
BioSonic
98.7%
Kaleidoscope
73.0%
BIOSONIC
Confusion Matrix · Accuracy 99.6%
PREDICTED BAT
PREDICTED NO BAT
ACTUAL BAT
716
TRUE POSITIVE
3
FALSE NEGATIVE
ACTUAL NO BAT
16
FALSE POSITIVE
4,579
TRUE NEGATIVE
KALEIDOSCOPE PRO
Confusion Matrix · Accuracy 93.8%
PREDICTED BAT
PREDICTED NO BAT
ACTUAL BAT
440
TRUE POSITIVE
49
FALSE NEGATIVE
ACTUAL NO BAT
277
FALSE POSITIVE
4,503
TRUE NEGATIVE
WHERE KALEIDOSCOPE PRO BREAKS
Every dot is one error
FALSE POSITIVES (Wrong "bat" calls)
Cost: investigator time wasted reviewing non-bat audio, inflated species counts
BIOSONIC
16
KALEIDOSCOPE
277
Kaleidoscope: 17.3× more
FALSE NEGATIVES (Missed bats)
Cost: protected species overlooked, incomplete EIA, compliance risk
BIOSONIC
3
KALEIDOSCOPE
49
Kaleidoscope: 16.3× more
Same data, very different outcomes. BioSonic delivers 98.7% F1 with only 19 errors across 5,314 predictions. Kaleidoscope Pro misses 10% of true bats and produces 17× more false calls — meaning consultants spend hours reviewing false detections that BioSonic never flags, and still miss protected species that Kaleidoscope fails to catch.

Source: Table 1 — Wilder Sensing validation study, Grassland + Paludiculture combined datasets (strict matching; Kaleidoscope Pro NoIDs not rewarded as true positives).

INDEPENDENT VALIDATION
Southern Jylland — Validated by Jan Drachmann Study

Five detectors, 11 species, one conclusion: BioSonic reaches identical ecological conclusions as manual analysis — same detector ranking (which monitoring locations had the most bat activity), same patterns — while catching more rare and protected species.

✨ NATTER’S BATS INSIGHT
Going through tens of thousands of files by hand, it’s easy to miss a few. Jan found 11 Natter’s bat calls — BioSonic found 100. On review, all 100 were validated as correct. That’s the payoff of AI on large datasets: nothing slips through.

Detector Ranking — Identical Results

D4 > D5 > D2 > D1 > D3 — same order whether counted by hand or by AI

Manual BioSonic
391
461
D1
1,156
1,688
D2
94
118
D3
23,527
25,514
D4
2,370
3,505
D5

Common Species

BioSonic detects more Pipistrel (+203%) and Trold (+16%)

Manual BioSonic
Dværg
13,556
10,669
Trold
11,433
13,248
Pipistrel
2,257
6,834

Rare & Protected Species

Separate scale — these are the ones that matter for Annex II compliance

Manual BioSonic
Vand
112
221
Frynse
11
100
Dam
0
0
Brun
40
41
Syd
55
67

BioSonic Finds More (%) — Per Species

Positive = BioSonic found more; Negative = Manual found more

+16%
+203%
+97%
+809%
+3%
+22%
-21%
0%
-100%
-100%
-100%
Dværg
Trold
Pipistrel
Vand
Frynse
Dam
Brun
Syd
Skimmel
Nyctaloid
Myotis

Comparison by Phonic Group

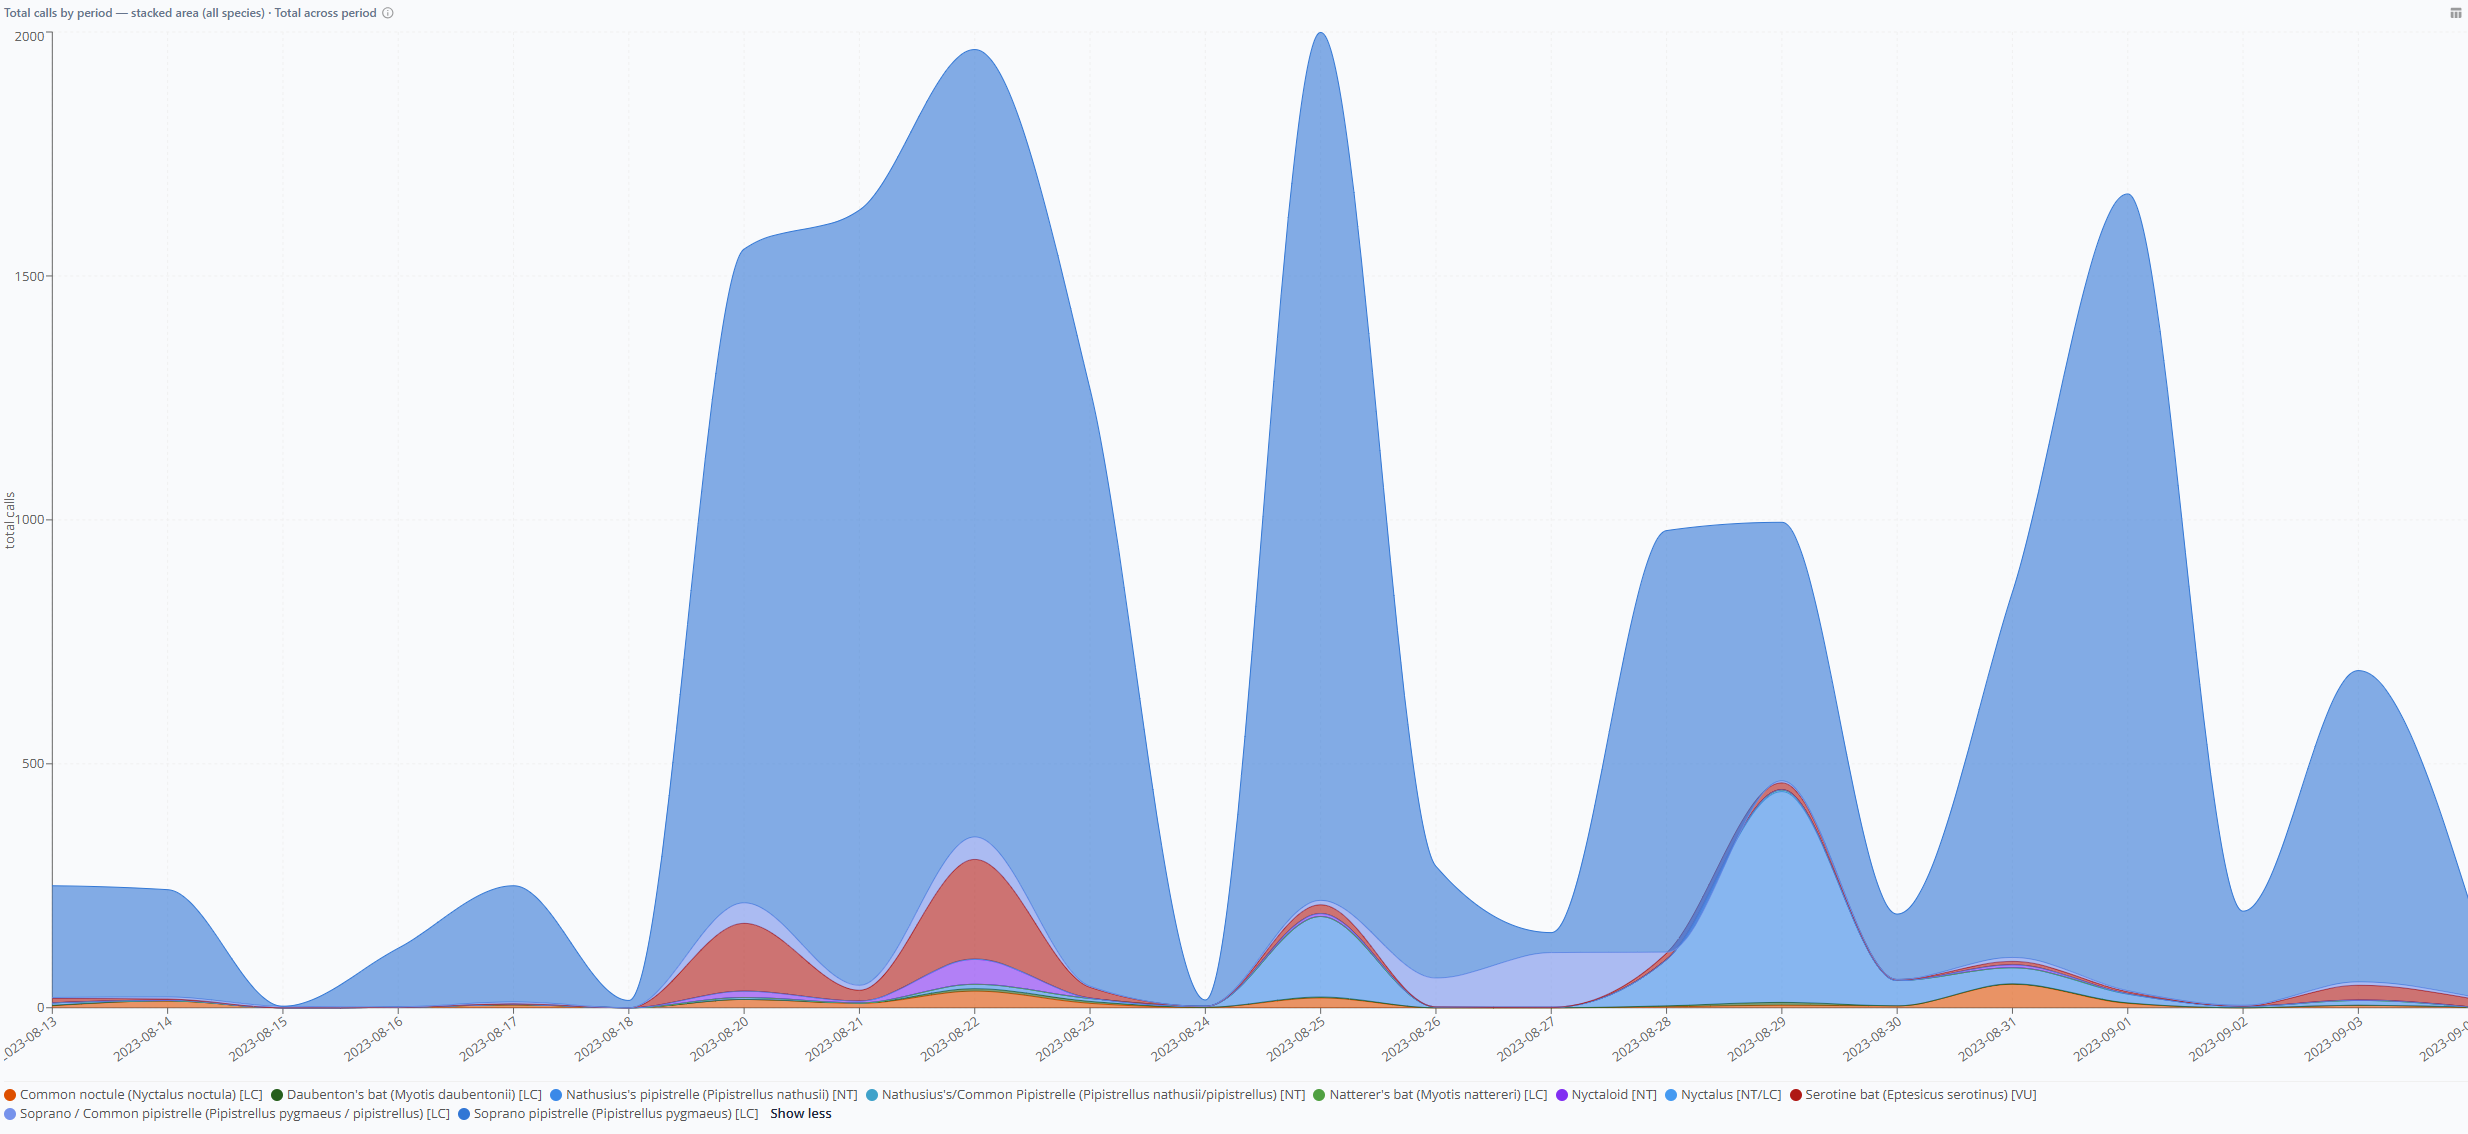
Grouped by echolocation type — differences shrink dramatically at group level.

Manual BioSonic
27,246
30,751
Pipistrellus
186
321
Myotis
106
108
Nyctaloid
log scale
Pipistrellus: Dværg + Trold + Pipistrel · Myotis: Vand + Frynse + Dam + Myotis sp. · Nyctaloid: Brun + Syd + Skimmel + Nyctaloid sp.

% of Total Detections per Species

Species with large % differences make up tiny fractions of total.

Manual % BioSonic %
49.2%
34.2%
Dværg
41.5%
42.5%
Trold
8.2%
21.9%
Pipistrel
0.4%
0.7%
Vand
0.04%
0.3%
Frynse
0%
0%
Dam
0.2%
0.1%
Brun
0.2%
0.2%
Syd
0%
0%
Skimmel
0.04%
0%
Nyctaloid
0.2%
0%
Myotis sp.
Danish Scientific Phonic Group Manual BioSonic Diff Diff % Expert Comment
DværgP. pygmaeusPipistrellus13,55610,669-2,887-21.3%Redistribution within Pip group
TroldP. pipistrellusPipistrellus11,43313,248+1,815+15.9%“More or less the same”
PipistrelP. nathusiiPipistrellus2,2576,834+4,577+202.8%Key migration species — likely noise recovery
VandM. daubentoniiMyotis112221+109+97.3%Confirmed correct, missed in noise files
FrynseM. nattereriMyotis11100+89+809.1%“They’re more or less all correct” — expert verified
DamM. dasycnemeMyotis0000.0%Agreement — no detections
Myotis sp.Myotis sp.Myotis630-63-100%BioSonic classified to species — “no problem”
BrunN. noctulaNyctaloid4041+1+2.5%Near-perfect match
SydP. kuhlii / E. serotinusNyctaloid5567+12+21.8%Close match for rare species
SkimmelV. murinusNyctaloid10-1-100%Single call — statistically negligible
Nyctaloid sp.Nyctaloid sp.Nyctaloid100-10-100%BioSonic classified to species level
Total27,53831,180+3,642+13.2%
CUSTOMER QUOTE
Independent bat expert, Denmark
Jan Drachmann
Independent Bat Expert, Denmark
Manual: D4 > D5 > D2 > D1 > D3
BioSonic: D4 > D5 > D2 > D1 > D3
Identical ✓
“Detector 4 is the most important place for bats. The ranking is the same — both your and my analysis agree: D4 > D5 > D2 > D1 > D3. The ecological conclusions are identical.”
WHAT BIOSONIC DOES
BioSonic. One place for all your bat analysis.

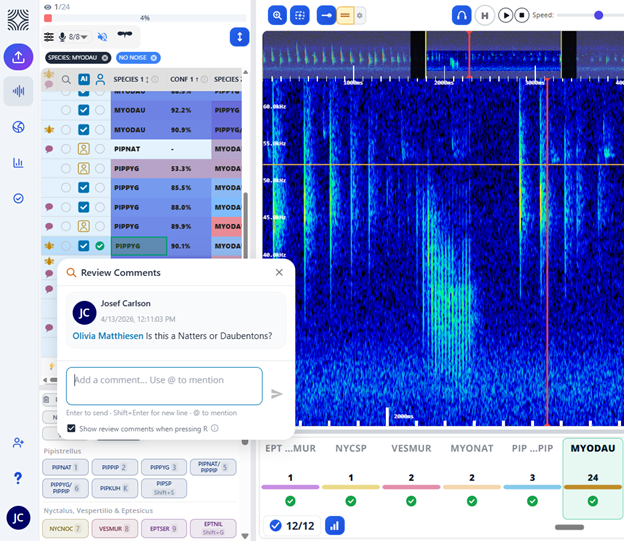
Every feature your team needs to analyse bat sound at scale — AI detection, spectrogram review, team collaboration and report-ready visualisations in a single platform.

AI bat sound analysis
Leading accuracy for bat classification across the UK and Northern Europe.
7+
7+ species per file
Multi-label detection — every species captured, never collapsed into one label.
Feeding & social call split
Classify behaviour — know what the bat is doing, not just that it passed.
Integrated spectrogram viewer
Integrated spectrogram review — verify any detection in one click.
Skip high-confidence files
The AI auto-approves, letting you focus on the rare calls below confidence thresholds.
Comments & collaboration
Comment on tricky files — ask colleagues for a second opinion without leaving the app.
Heatmaps & automatic weather data
Automatic weather integration and heatmaps — report-ready visualisations.
SEE IT IN ACTION
Spectrogram viewer with review comments
Spectrogram Viewer
Review detections, comment & collaborate
Species heatmap on satellite map
Species Heatmap
Detection density per location on satellite map
Activity over time stacked area chart
Activity Over Time
Total calls by species across monitoring period
GPS transect route mapping
Transect Mapping
GPS route with bat detections along the path
BAT ACTIVITY OVER TIME
Feeding, social calls & species activity across the night
SPECIES ACTIVITY OVER TIME
Each species has its own emergence & activity window
SUNSET SUNRISE 0004 0812 1620 24 HOUR OF DAY EPTSER BARBAR NYCNOC PIPPYG
SOCIAL & FEEDING CALLS
Both spike sharply right at sunset
SUNSET SUNRISE 0004 0812 1620 24 HOUR OF DAY Feeding buzz (hunting) Social call (roost / mating)
ACTIVITY HEATMAPS · BEHAVIOR × LOCATION
Feeding Activity where bats are hunting
Feeding buzzes · spread across foraging habitat
Feeding buzzes cluster over wetlands, forest edges and coastal habitats — BioSonic identifies prime foraging zones for EIA planning.
Social Call Activity where roosts are
Social calls · concentrated near roosts
Social calls cluster tightly near roosts — BioSonic pinpoints roost locations within 500m, critical for windmill placement decisions.
EPTSER BARBAR NYCNOC PIPPYG
INTERACTIVE BATMAP
BUSINESS CASE
327 hours saved per 2 TB — £21,255 back in the budget.

Real comparison from an ecology consultancy in south England, measuring time spent on sound analysis between Kaleidoscope Pro and BioSonic on the same 2 TB dataset.

TIME SAVED
66%
per 2 TB of sound analysis
HOURS SAVED
327h
out of 495h total manual effort
SAVINGS PER 2 TB
£21,255
327 h × £65/h
COST PER 2 TB
Kaleidoscope Pro (495h × £65)£32,175
BioSonic (168h × £65)£10,920
£21,255 saved per 2 TB of manual review cost
ECOLOGIST FEEDBACK
What bat workers think about BioSonic
Lars Michael Nielsen
Biologist, DMR
"It's seldom wrong, it's a pleasure using it and it's making my job easier."
Peter Sivertsen
Peter Sivertsen
Biologist
"What sets BioSonic apart is their exceptional accuracy, both in species identification and in filtering out noise. In this, they're truly at the top."
Luke Waddison
Luke Waddison
Ecological Consultant, WNIC
"Since joining BioSonic our analysis time has reduced significantly, freeing us up to take on different tasks. The system is a pleasure to use and the team are excellent in their support."
James Shipman
James Shipman
Senior Ecologist, Author, Jacobs
"This is all cutting edge stuff and the way bat work will go! I look forward to seeing it go strength to strength."
Andre Dabolins
André Dabolins
CEO, EcoFauna
"Going through 100K files can take me 14 days. With BioSonic I review them in 2 days."
Geoff Carss
Geoff Carss
Wilder Sensing · + Annabel Jeffries
"We tested a range of existing solutions using real acoustic data, and BioSonic clearly stood out, achieving 98.7% accuracy (F1 score)."
Jacob Hojgaard
Jacob Højgaard
PhD Ecology, NLABT
"BioSonic always impresses me with how well it detects bats, even from the faintest bat calls."
Sofia Berg
Sofia Berg
"Today we survey too short a time and risk missing key species. Together with BioSonic, we can keep track of even the most rare species."
Martin Pilstjärna
Martin Pilstjärna
Ph.D Ecology, Impact Director, Qarlbo Biodiversity
"BioSonic provided us with excellent service throughout the data collection process and delivered well in relation to our agreement. I am more than inclined to recommend them as a provider of bioacustic data for biodiversity projects elsewhere."
LINKEDIN
Online comments on BioSonic

Unprompted, on the open internet — from ecology consultants who actually use the platform.

GEOFF CARSS · WILDER SENSING
Geoff Carss LinkedIn post
BLOOM ECOLOGY
Bloom Ecology LinkedIn post
COWI
COWI LinkedIn post
JAMES SHIPMAN · DMR
James Shipman DMR LinkedIn post
BIOSONIC
Let's see what BioSonic can do for your bat projects.

Start for free — or book a walkthrough.

Josef Carlson
CEO & Founder, BioSonic
josef.carlson@biosonic.se · biosonic.se

BioSonic in Action